
Drawing Areas of Interest#
Overview
This tutorial will introduce an AOI drawing tool, AOIDrawer, and showcase some basic AOI-based analyses you can do with PupEyes.
The AOI Drawer#
PupEyes includes an AOIDrawer that allows you to manually define AOIs. The defined AOIs will be saved as a .json file and can be used in other PupEyes functions.
from pupeyes import AOIDrawer

# path to image
background_img = 'assets/street1.jpg'

# Create and run the drawer
# drawer = AOIDrawer(screen_dims=(1600, 1200), stimuli=background_img, stimuli_name='street1')

# drawer.run()
The saved AOIs can be reloaded and used in other PupEyes functions. For example, let’s load the saved AOIs and redraw them.
import json

# load AOIs
with open('assets/street1_aois.json', 'r') as f:
    aois = json.load(f)
aois is a Python dictionary that stores the vertices of each AOI. The last point repeats the first point to close the polygon.
print('lights', aois['lights'])
lights [[229.32328532512912, 178.23073308270676], [357.8947138965577, 178.23073308270676], [357.8947138965577, 349.65930451127815], [229.32328532512912, 349.65930451127815], [229.32328532512912, 178.23073308270676]]
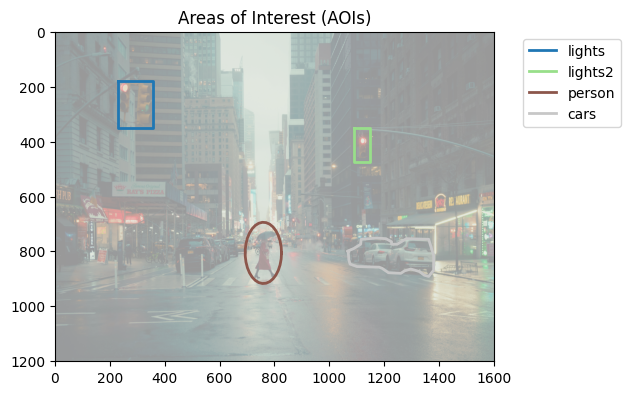
Let’s draw these AOIs using draw_aois() from PupEyes
from pupeyes import draw_aois

# draw AOI
draw_aois(aois, screen_dims=(1600, 1200), background_img=background_img)
Original size: (6231, 4154) Resized size: (1600, 1200)
(<Figure size 640x480 with 1 Axes>,
 <Axes: title={'center': 'Areas of Interest (AOIs)'}>)
Calculating Basic AOI Measures#
To illustrate how the defined AOIs can be used in subsequent analyses, we will do some simple AOI-based analysis: we will assign each fixation to an AOI and compute some basic AOI measures.
import numpy as np
import pandas as pd

# generate some fake data
fixations = np.array([
    (50, 50, 200), # None
    (300, 250, 300), # lights
    (500, 250, 100), # None
    (750, 800, 350), # person
    (750, 800, 250), # person
    (750, 600, 100), # None
    (1100, 800, 450), # cars
    (1100, 400, 150), # lights2
    (1500, 400, 1000)] # None
                    )
fixation_data = pd.DataFrame(fixations, columns=['x','y','duration'])
fixation_data['correct_aoi'] = [None, 'lights', None, 'person', 'person', None, 'cars', 'lights2', None]
fixation_data
| x | y | duration | correct_aoi | |
|---|---|---|---|---|
| 0 | 50 | 50 | 200 | None |
| 1 | 300 | 250 | 300 | lights |
| 2 | 500 | 250 | 100 | None |
| 3 | 750 | 800 | 350 | person |
| 4 | 750 | 800 | 250 | person |
| 5 | 750 | 600 | 100 | None |
| 6 | 1100 | 800 | 450 | cars |
| 7 | 1100 | 400 | 150 | lights2 |
| 8 | 1500 | 400 | 1000 | None |
from pupeyes.aoi import get_fixation_aoi, compute_aoi_statistics

# get the corresponding AOI for each fixation
fixation_data['aoi'] = get_fixation_aoi(x=fixations[:, 0], # x pos
                                        y=fixations[:, 1], # y pos
                                        aois=aois)
# assigned aois match the correct aois
fixation_data
| x | y | duration | correct_aoi | aoi | |
|---|---|---|---|---|---|
| 0 | 50 | 50 | 200 | None | None |
| 1 | 300 | 250 | 300 | lights | lights |
| 2 | 500 | 250 | 100 | None | None |
| 3 | 750 | 800 | 350 | person | person |
| 4 | 750 | 800 | 250 | person | person |
| 5 | 750 | 600 | 100 | None | None |
| 6 | 1100 | 800 | 450 | cars | cars |
| 7 | 1100 | 400 | 150 | lights2 | lights2 |
| 8 | 1500 | 400 | 1000 | None | None |
compute_aoi_statistics() allows you to compute basic AOI-based measures, given the x and y coordinates, AOIs, and fixation durations.
# compute aoi statistics
results = compute_aoi_statistics(
    x=fixation_data['x'],
    y=fixation_data['y'],
    aois=aois,
    durations=fixation_data['duration']
)

# summarize results in a dataframe
pd.DataFrame(results)
| outside | lights | lights2 | person | cars | |
|---|---|---|---|---|---|
| count | 4.0 | 1.0 | 1.0 | 2.0 | 1.0 |
| total_duration | 1400.0 | 300.0 | 150.0 | 600.0 | 450.0 |
Tip
You can supply your own AOIs to draw_aoi(), get_fixation_aoi(), and compute_aoi_statistics().